> ## Documentation Index
> Fetch the complete documentation index at: https://bytebeam.io/docs/llms.txt
> Use this file to discover all available pages before exploring further.
# Push application logs
> Learn how to effectively view journalctl logs on Bytebeam cloud with this comprehensive document. Discover the step-by-step instructions on setting up streams and dashboards, adding logging to devices, and configuring logging from the cloud.
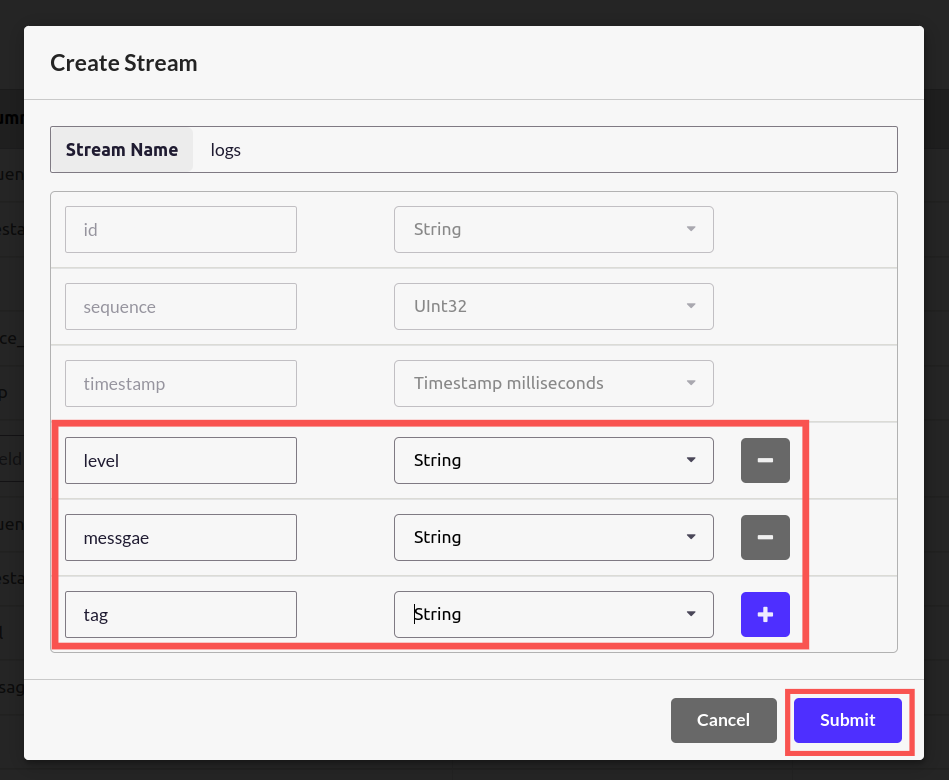
Using Bytebeam cloud, it is possible to view the logs of the device. This guide assumes your device is running using **systemd** and logs are being pushed to **journald**. This guide will show you how to view **journald** logs on the cloud. Create a stream called "**logs**", with the following parameters.
 Now, we need to create a "**logs**" dashboard.
# Create logs dashboard
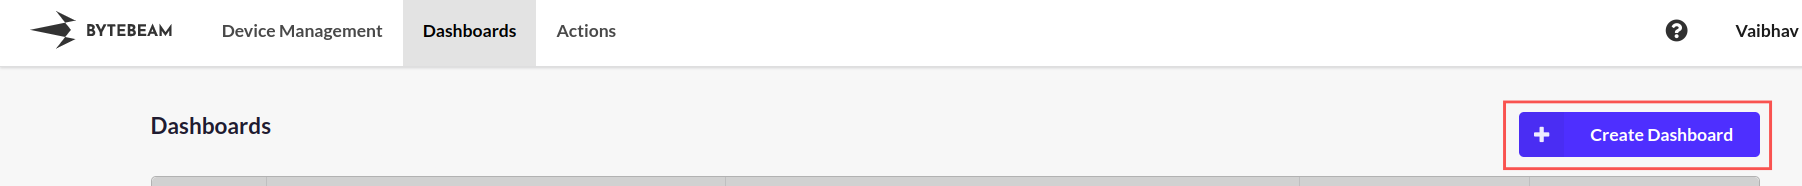
Go to the "**Dashboards**" section of Bytebeam Cloud and select "**Create Dashboard**"
Now, we need to create a "**logs**" dashboard.
# Create logs dashboard
Go to the "**Dashboards**" section of Bytebeam Cloud and select "**Create Dashboard**"
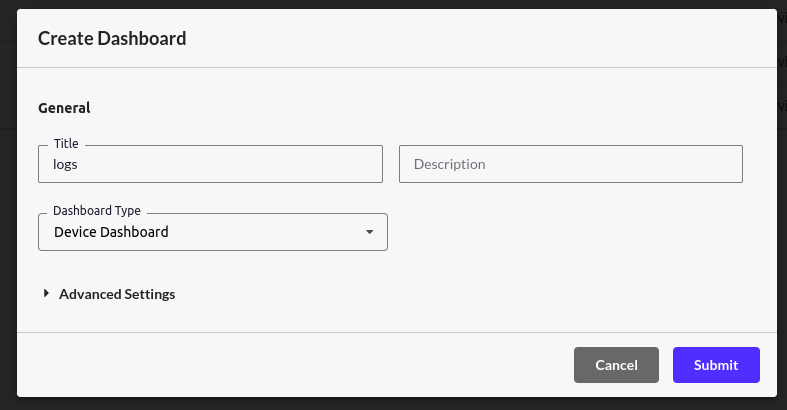
 Give the title "**logs**" and select the Dashboard type as "**Device Dashboard**". Click on submit.
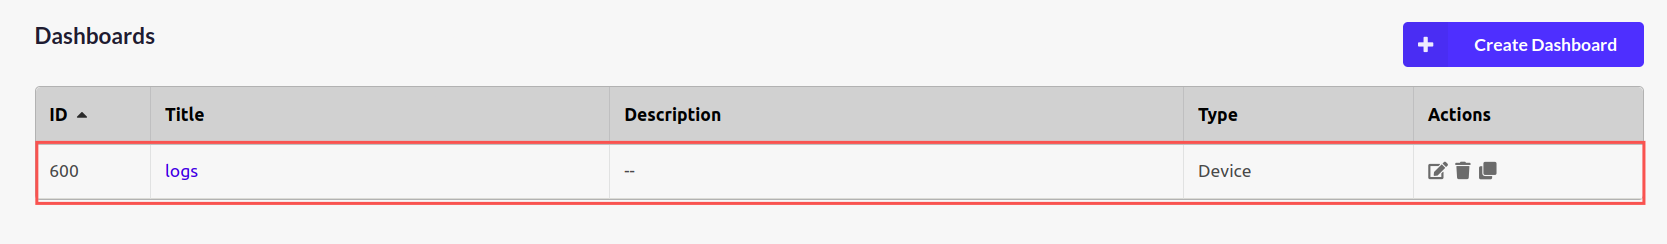
 The created dashboard should be visible now.
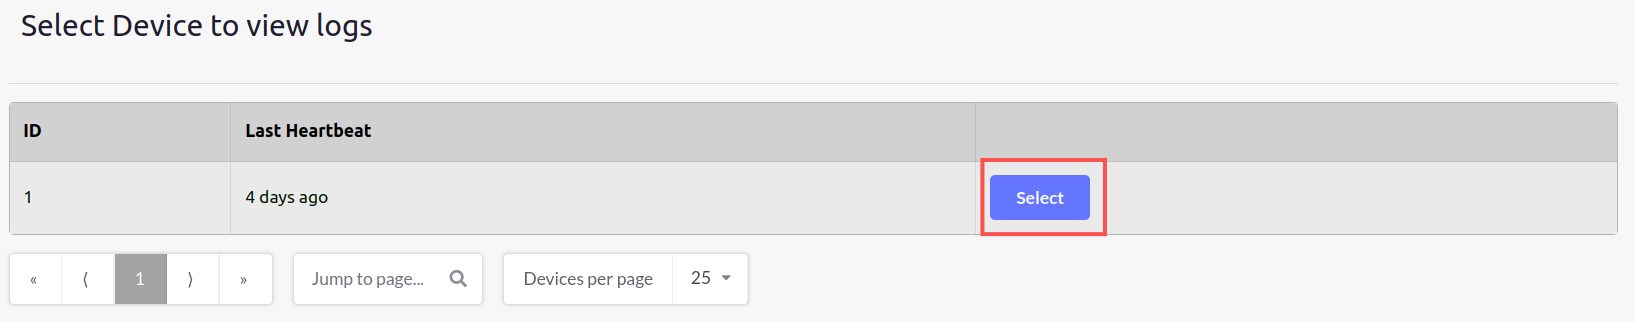
 Click on the "**logs**" dashboard and select the device for which you want to see the logs.
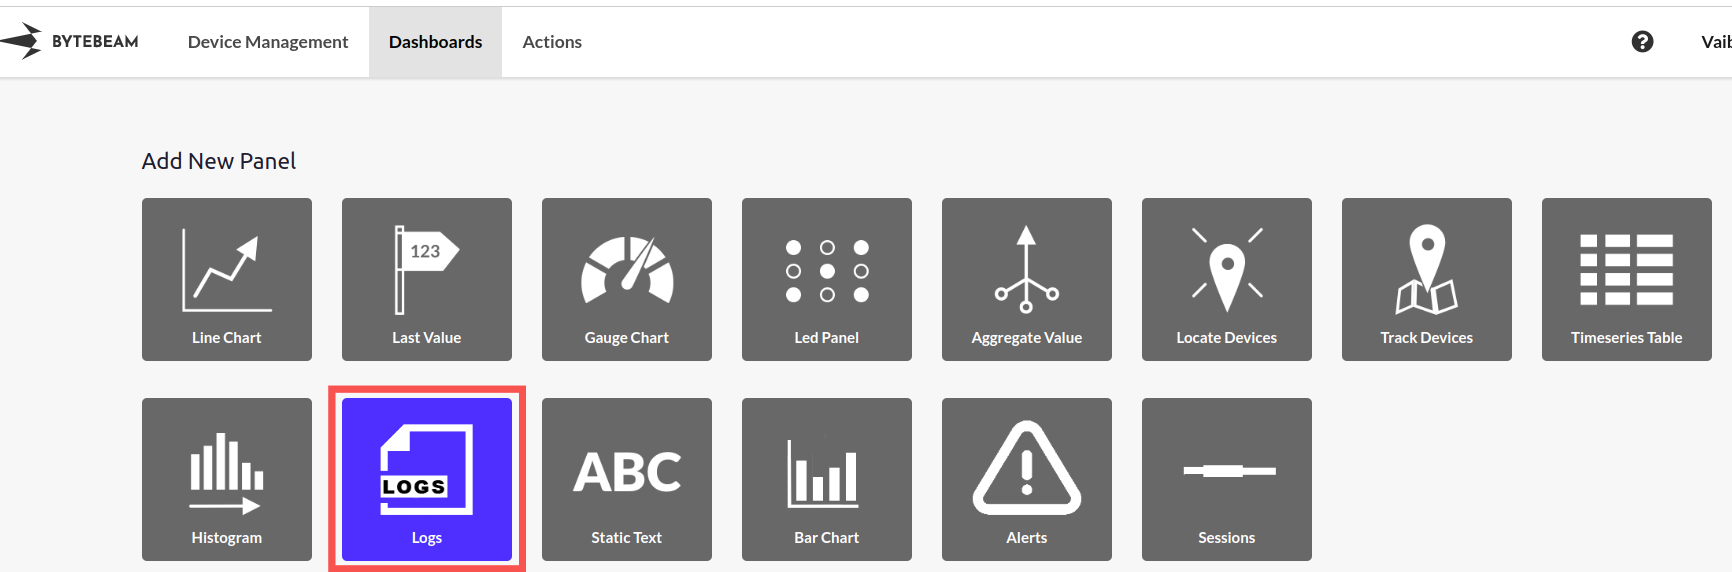
 Create a New Panel. Select the "Logs" panel.
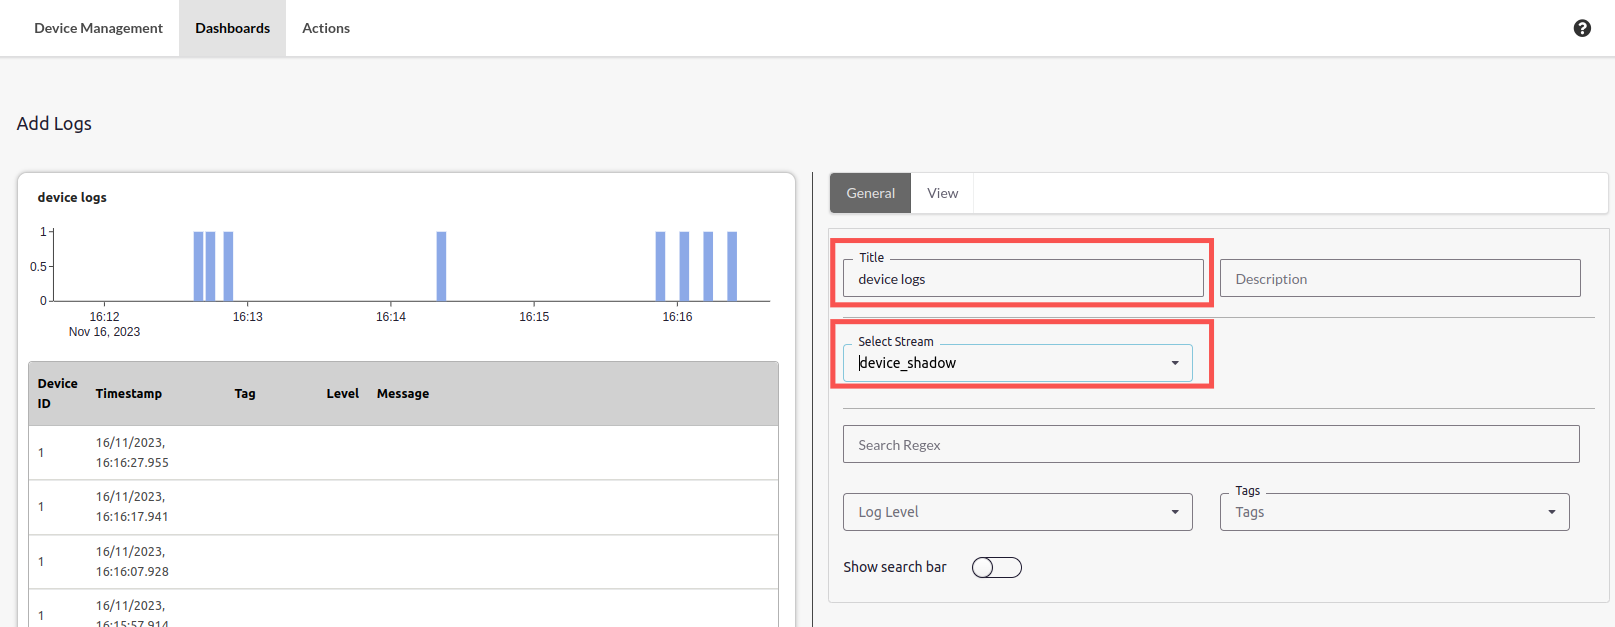
 Give the appropriate title and select the "**Logs**" option from the "**Table**" drop-down menu. Click on submit.
 To enable the logging feature on the device, the following lines are to be added to the config.toml file.
```none theme={null}
[logging]
tags=["sshd", "systemd"]
stream_size=1
min_level=7
```
Restart uplink.
The logs should be visible on the cloud now.
To enable the logging feature on the device, the following lines are to be added to the config.toml file.
```none theme={null}
[logging]
tags=["sshd", "systemd"]
stream_size=1
min_level=7
```
Restart uplink.
The logs should be visible on the cloud now.
 # Update log config from the cloud
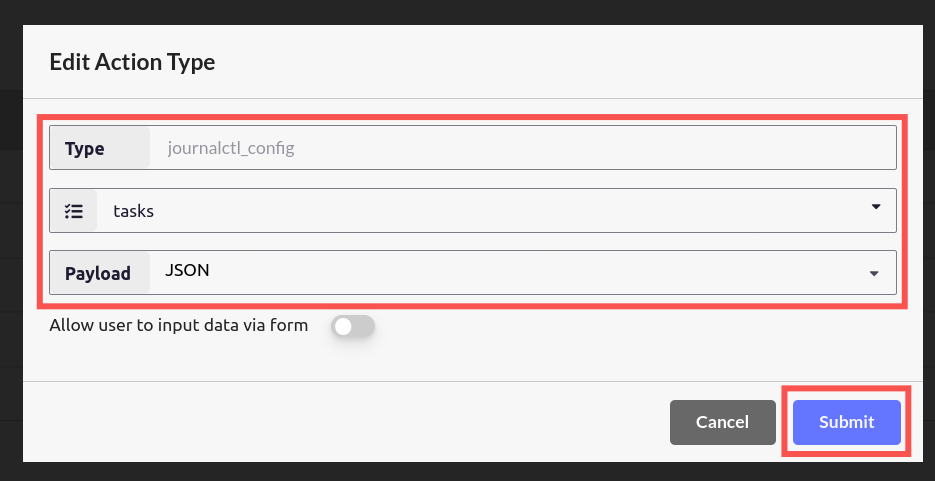
With the help of **config.toml** file, we can filter the logs related to a particular process. In this example, we see logs related to ssh. It is possible to change the logging configuration, from the cloud as well. To do that, we need to create a new Action type called "**journalctl\_config**". Follow the guide on [Creating new Action Types](/platform-guide/actions/action-settings/creating-an-action-type).
"**journalctl\_config**" is internally handled by uplink itself. It manages **log level** and **tags** Click on Submit.
# Update log config from the cloud
With the help of **config.toml** file, we can filter the logs related to a particular process. In this example, we see logs related to ssh. It is possible to change the logging configuration, from the cloud as well. To do that, we need to create a new Action type called "**journalctl\_config**". Follow the guide on [Creating new Action Types](/platform-guide/actions/action-settings/creating-an-action-type).
"**journalctl\_config**" is internally handled by uplink itself. It manages **log level** and **tags** Click on Submit.
 On the Device Management section, the "**journalctl config**" action should be visible.
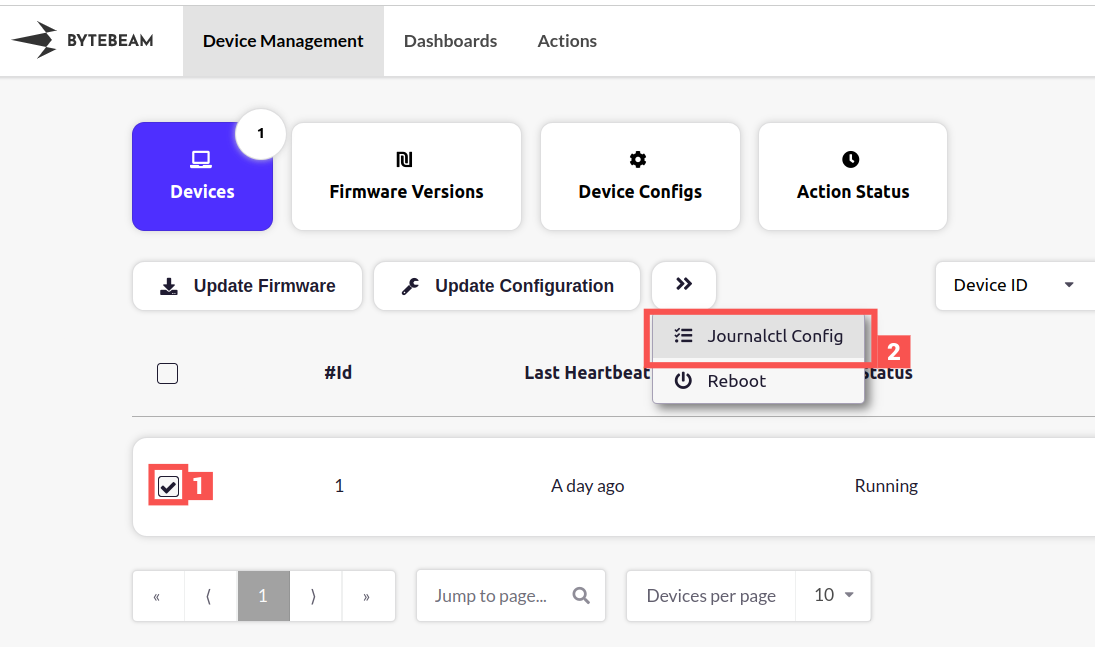 Select the device and click on "**Journalctl Config**". You will be prompted to create a JSON file. To see systemd logs also, use the following JSON. We can also choose the desired log level.
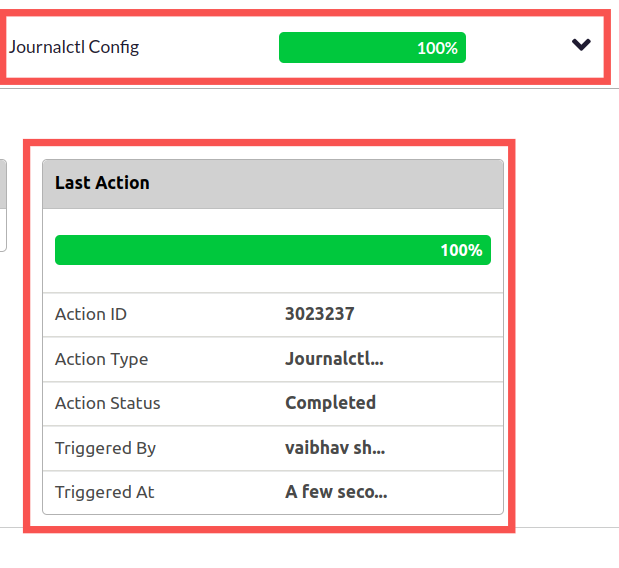
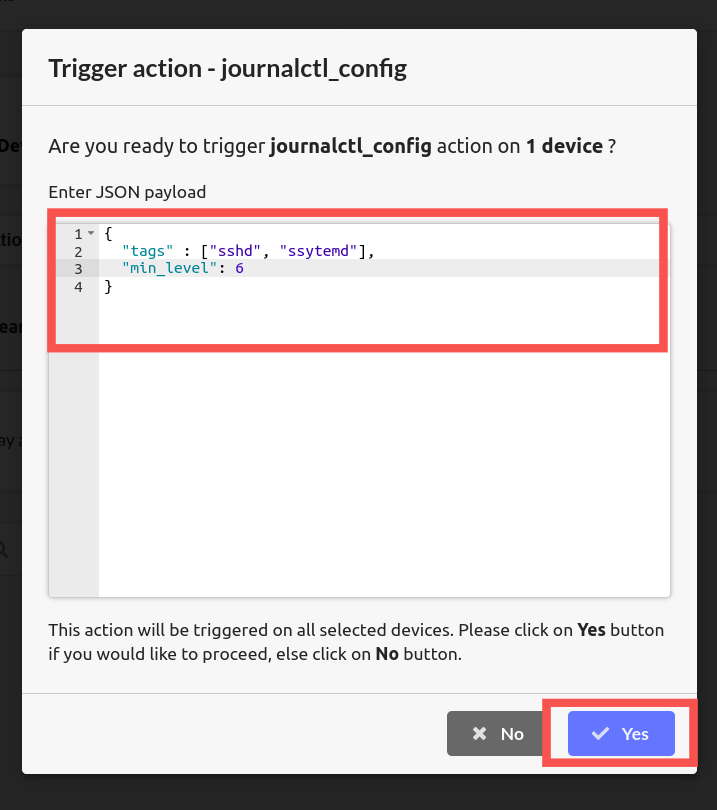 Click on yes. This will trigger "**Journalctl Config**" action. To view the logs, select the device and click on "**Device Dashboards**"
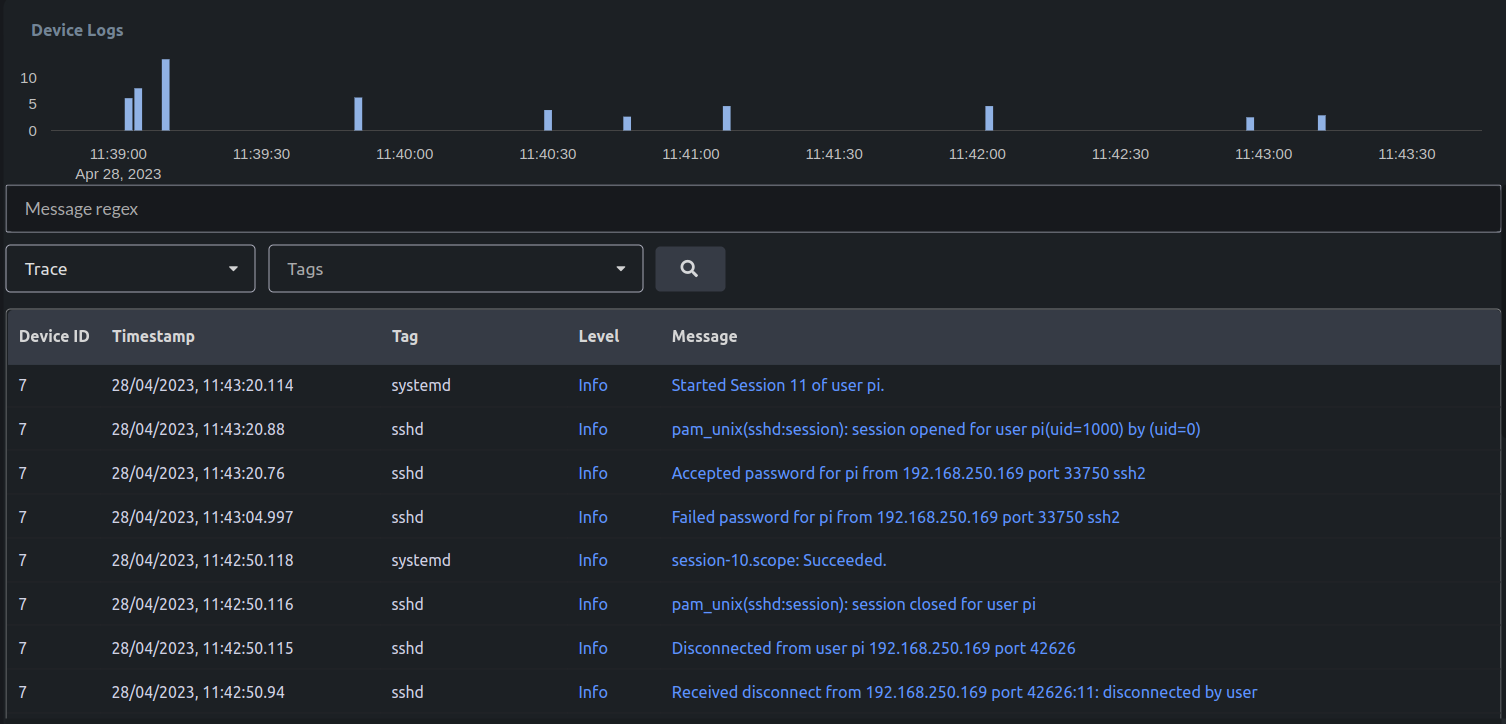
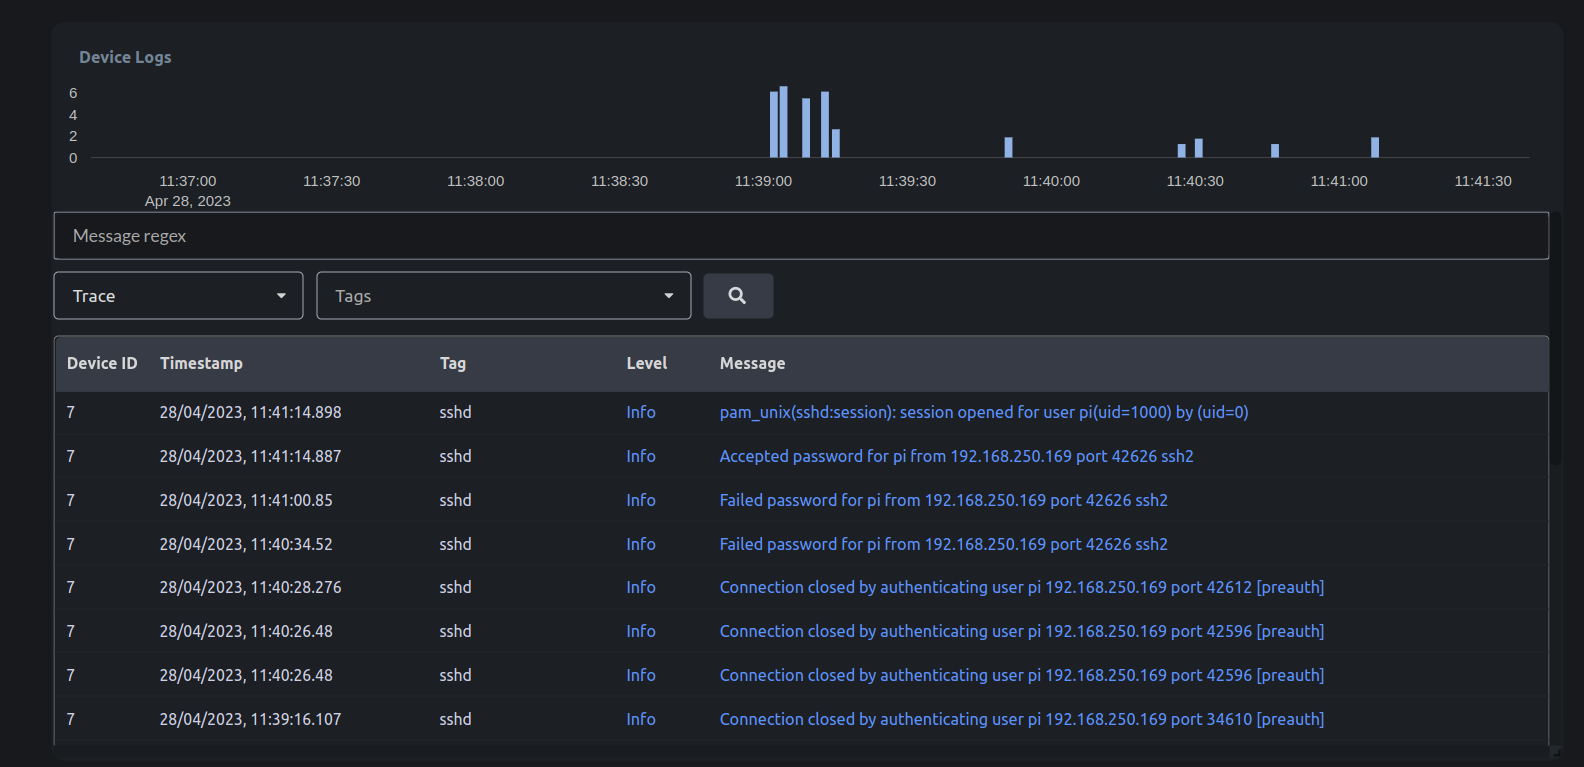
 Select "logs" Dashboard. Now, you should be able to see the logs of **sshd** and **systemd** as well.