> ## Documentation Index
> Fetch the complete documentation index at: https://bytebeam.io/docs/llms.txt
> Use this file to discover all available pages before exploring further.
# R5 08-Mar-2023
> Product Update by 08 Mar 2023, Changes in line chart, histogram, Configuration changes and other changes
## Line Chart - Ability to set custom range
Now the users can set custom range for the Y-axis when showing values in line chart
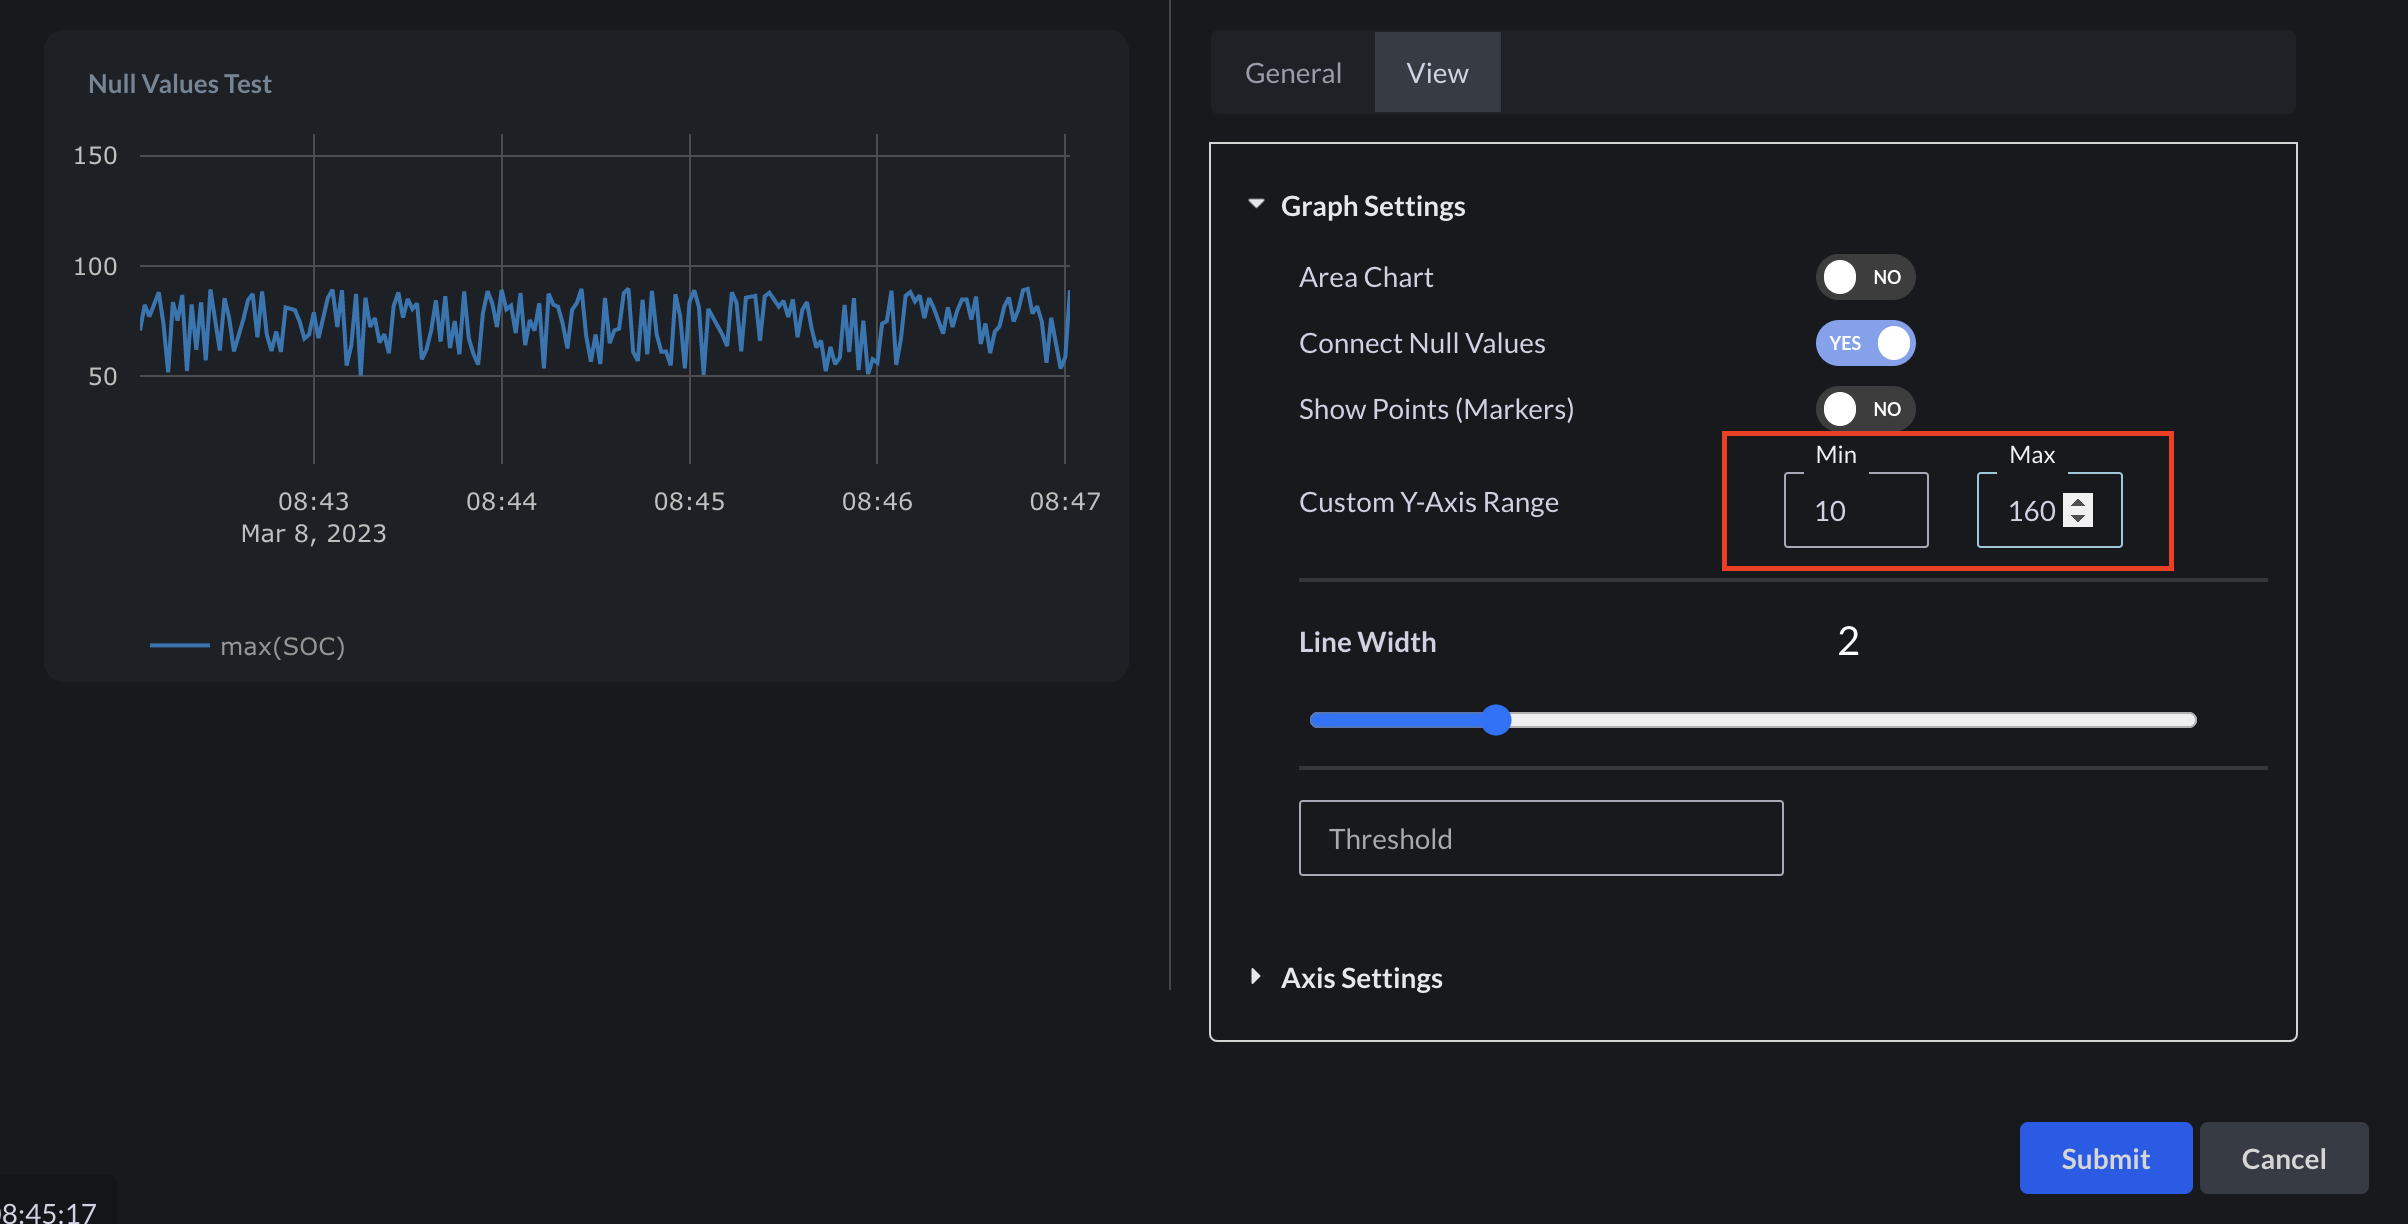 ## Line Chart - Disable/Enable connect null values
Null values can be connected or not represented in the line chart from the **View** settings
## Line Chart - Disable/Enable connect null values
Null values can be connected or not represented in the line chart from the **View** settings
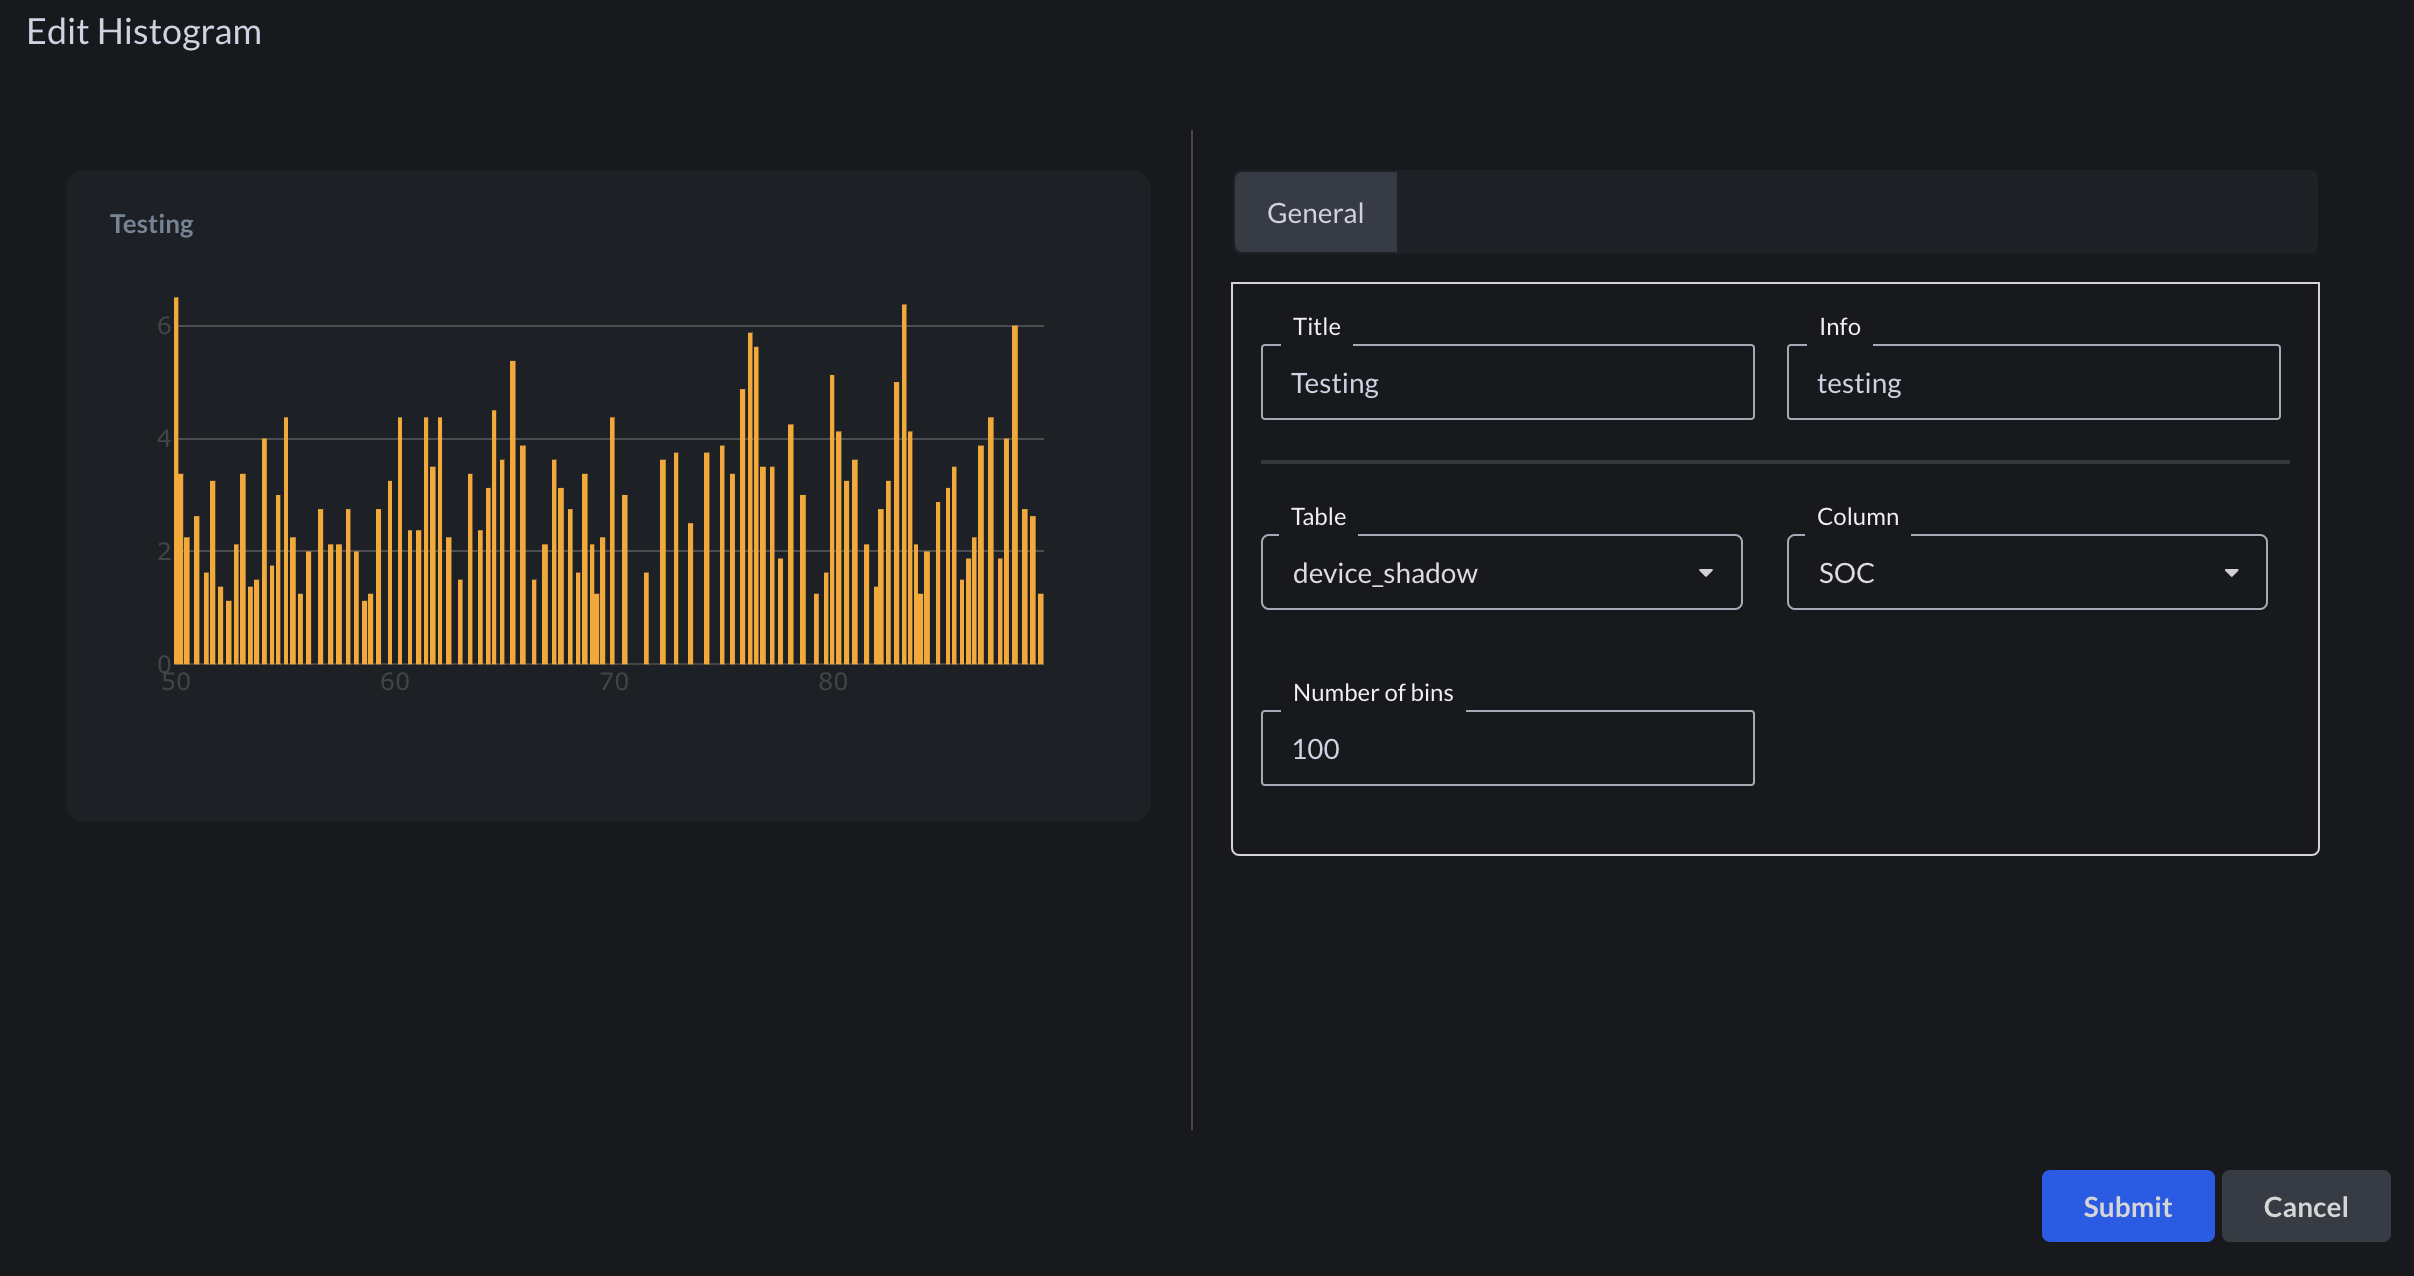
 ## Histogram panel
Now data can be visualised in the form of histogram, where we can select the stream and number of bins to classify the data into
## Histogram panel
Now data can be visualised in the form of histogram, where we can select the stream and number of bins to classify the data into
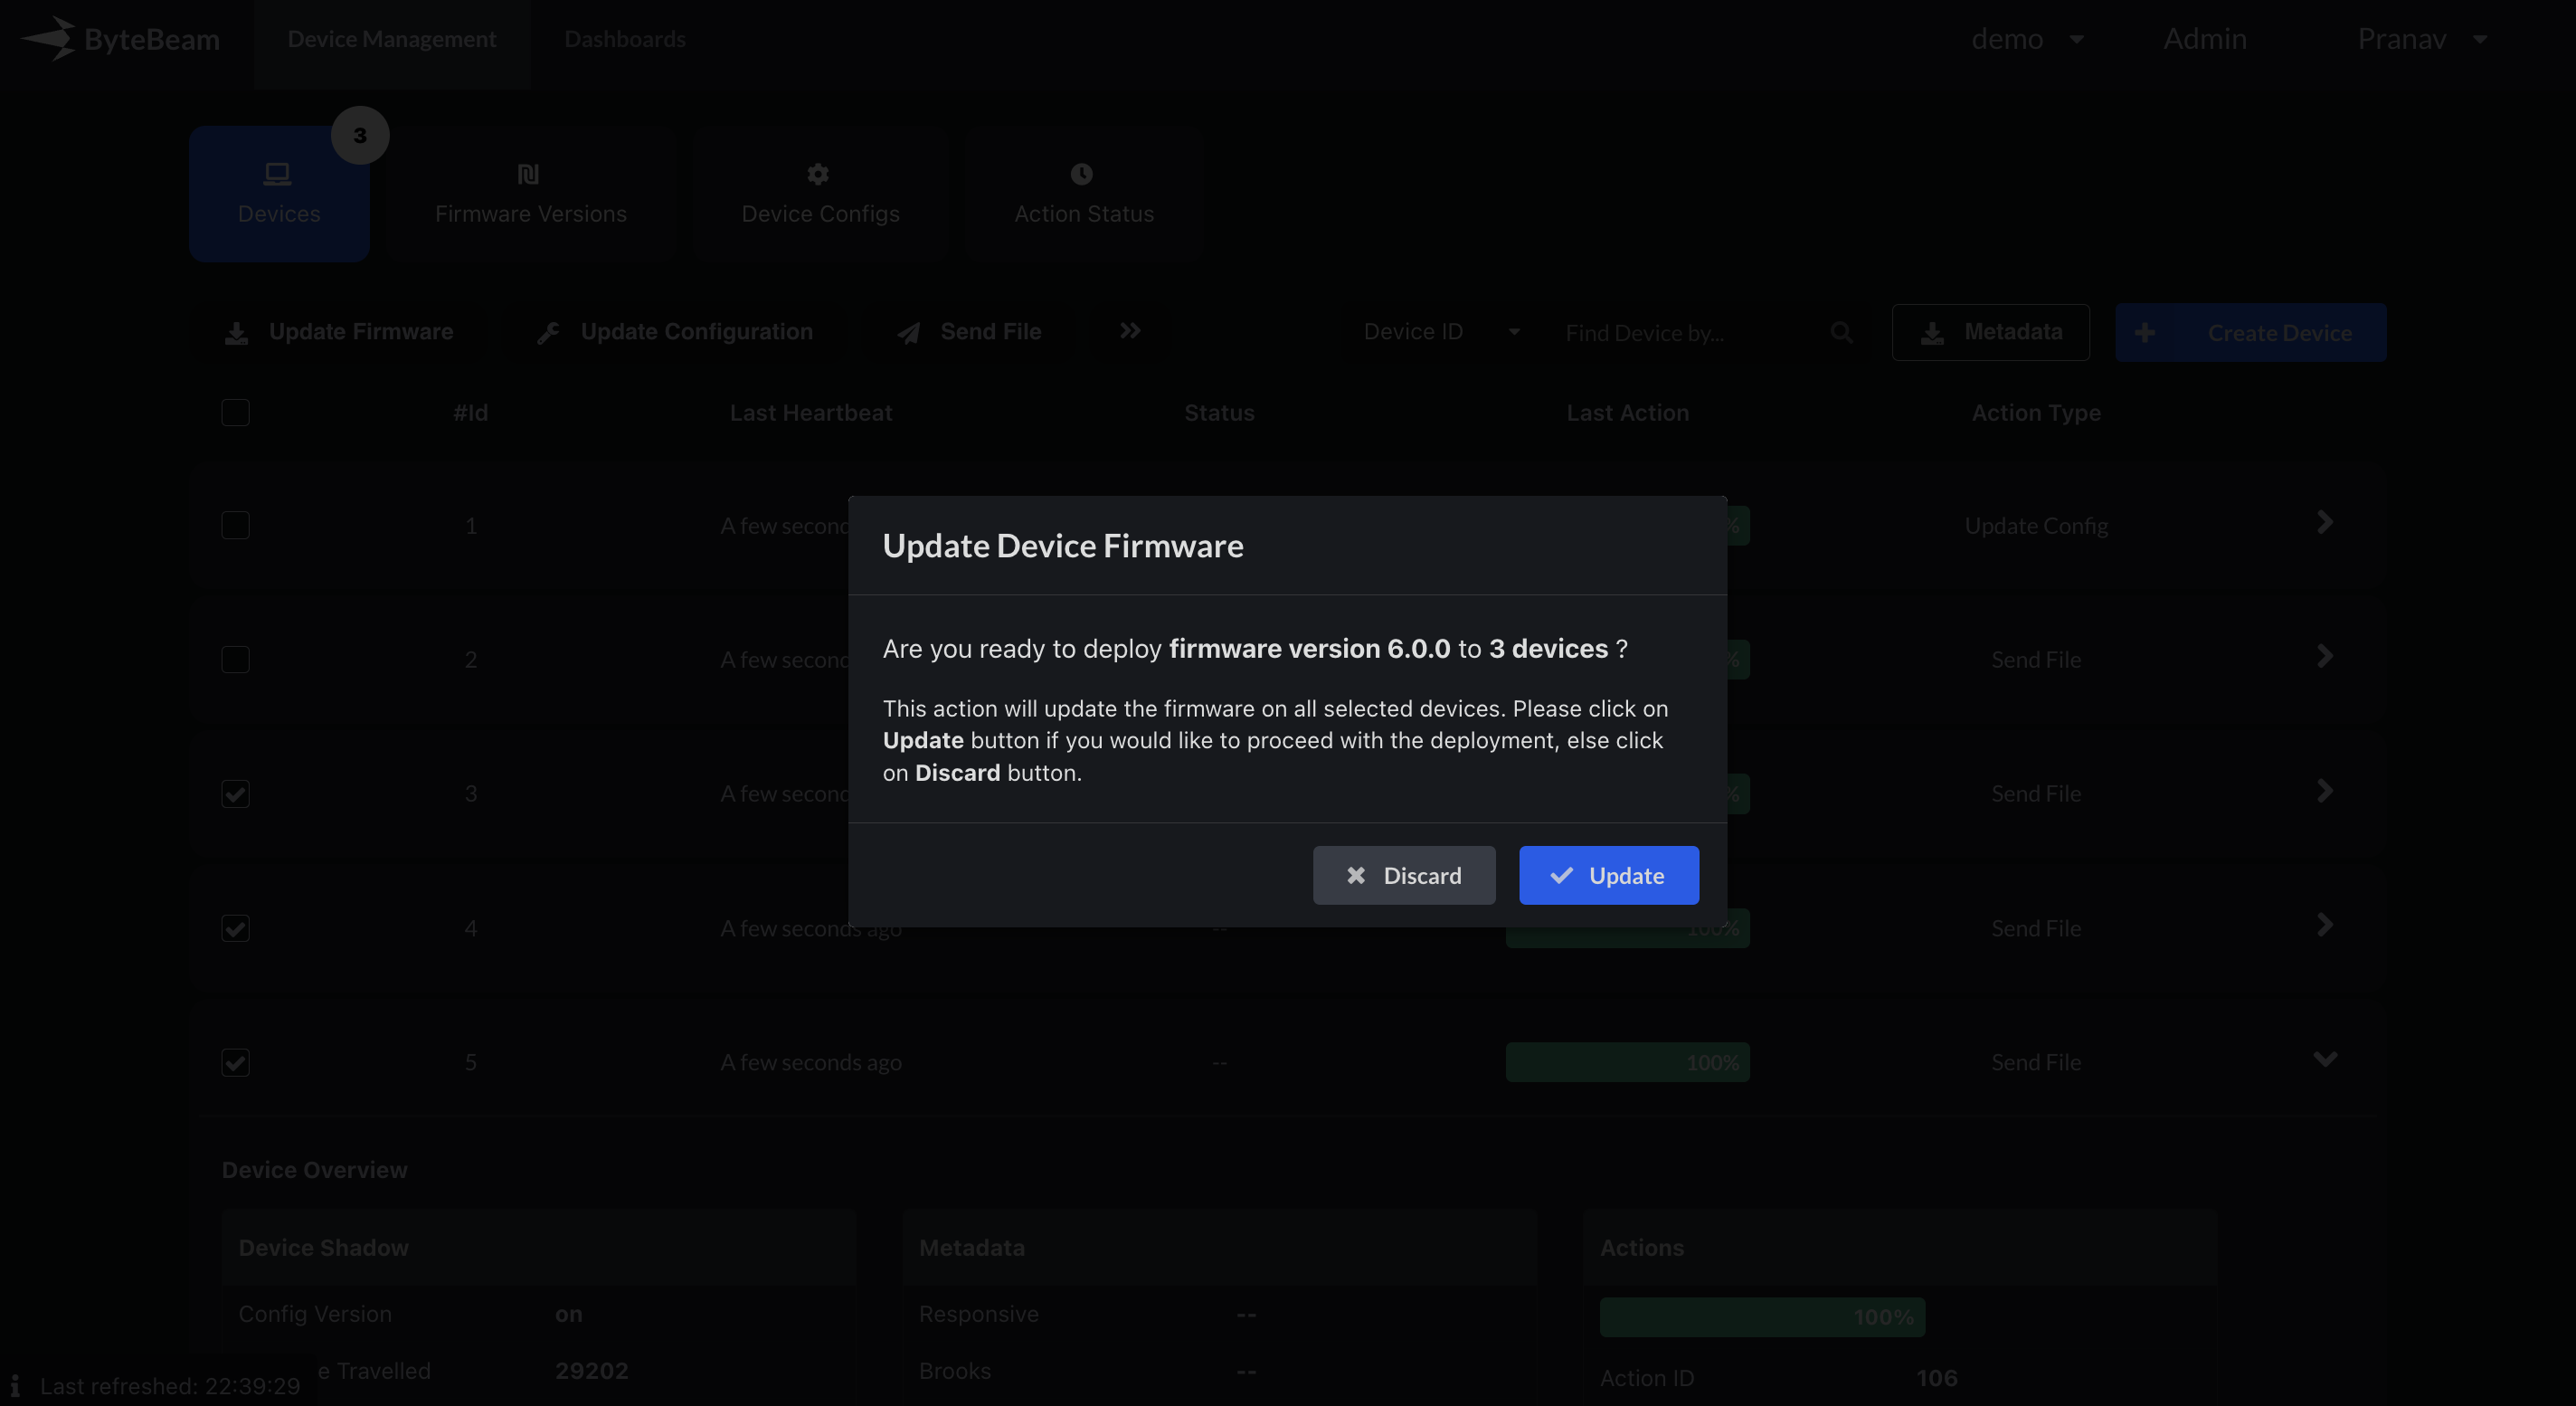
 ## Show confirmation "\ is going to be deployed on \ devices" before triggering firmware update action
When we trigger an action to update firmware, now we show a confirmation with version and device count as summary
## Show confirmation "\ is going to be deployed on \ devices" before triggering firmware update action
When we trigger an action to update firmware, now we show a confirmation with version and device count as summary
 ## **Data pipeline metrics**
We've added support to generate and collect important metrics in data pipeline. Metrics include:
* Metering data like:
* Number of active connections
* Amount of data received from devices
* Amount of data received on subscription
* Alerting data to capture errors
These metrics will be integrated with the UI and will be available for users soon.
## Bug fixes & Minor changes
* Change range in Line Chart only when the data has been fetched instead of before loading the complete data to avoid confusion
* Line Chart - Tooltip not completely visible when have to show many data points
* Fixed the loader not working properly when previous request was aborted in dashboard filters and time range change
* Bug fix in Welcome screen when new user was seeing blank screen
## **Data pipeline metrics**
We've added support to generate and collect important metrics in data pipeline. Metrics include:
* Metering data like:
* Number of active connections
* Amount of data received from devices
* Amount of data received on subscription
* Alerting data to capture errors
These metrics will be integrated with the UI and will be available for users soon.
## Bug fixes & Minor changes
* Change range in Line Chart only when the data has been fetched instead of before loading the complete data to avoid confusion
* Line Chart - Tooltip not completely visible when have to show many data points
* Fixed the loader not working properly when previous request was aborted in dashboard filters and time range change
* Bug fix in Welcome screen when new user was seeing blank screen