> ## Documentation Index
> Fetch the complete documentation index at: https://bytebeam.io/docs/llms.txt
> Use this file to discover all available pages before exploring further.
# R8 26-Apr-2023
> Product Update by 26 Apr 2023, Updates in Logs panel, Timerange in dashboard and other changes
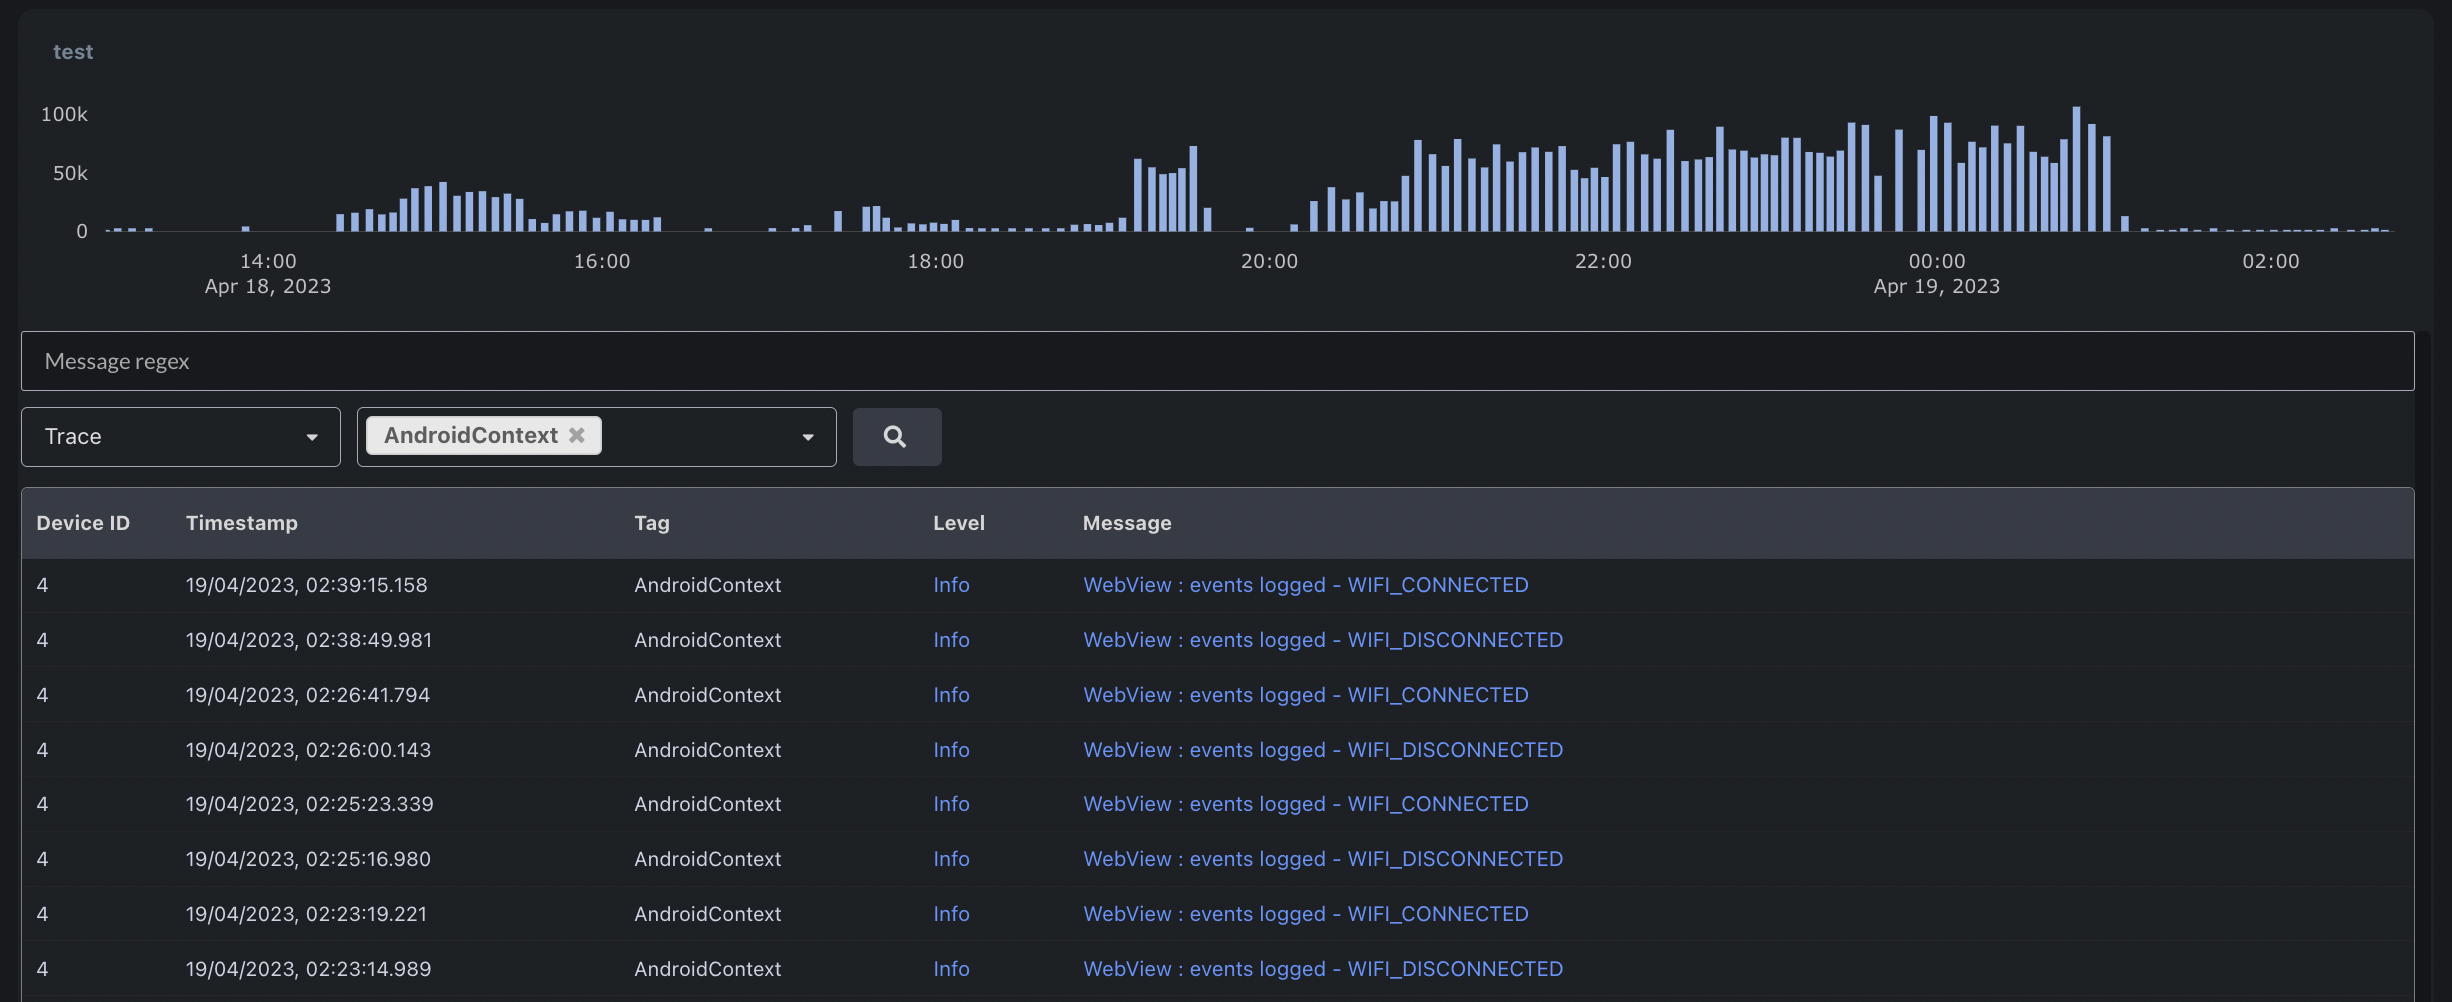
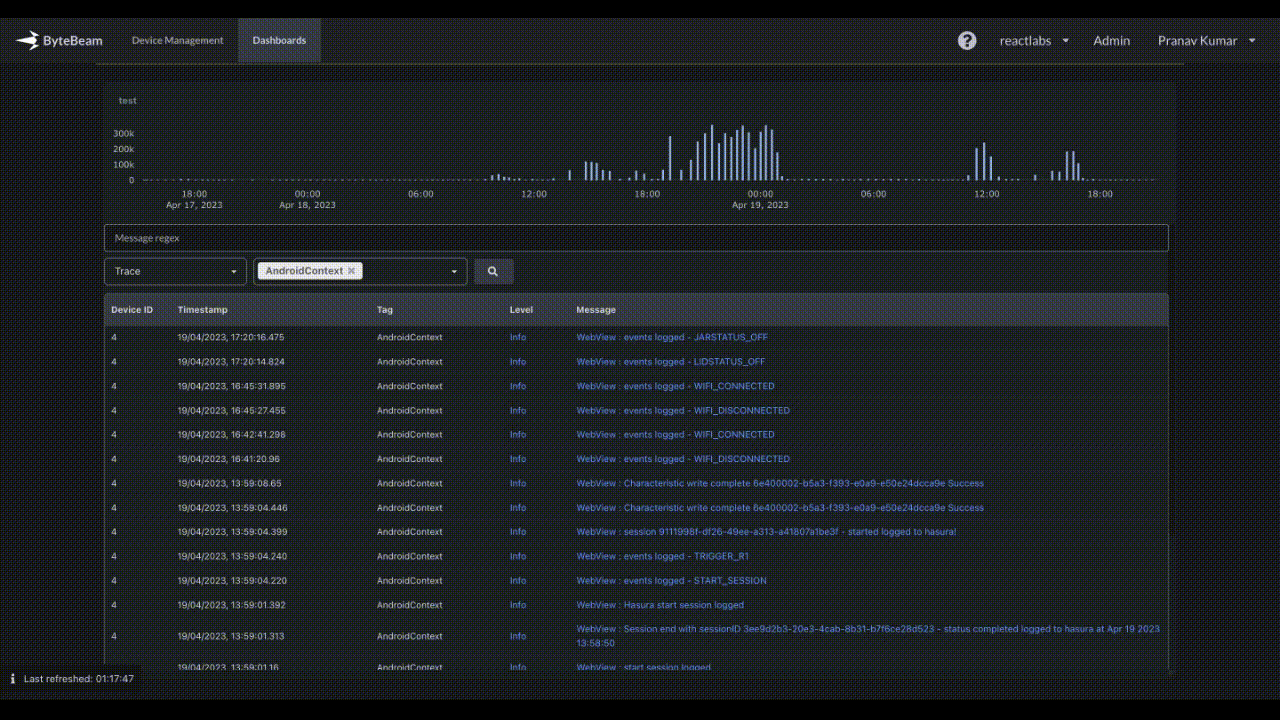
### Log volume histogram in Logs Panel
The Logs panel now displays a histogram of log volume, and users can zoom in on a specific timerange by dragging the cursor across the histogram.
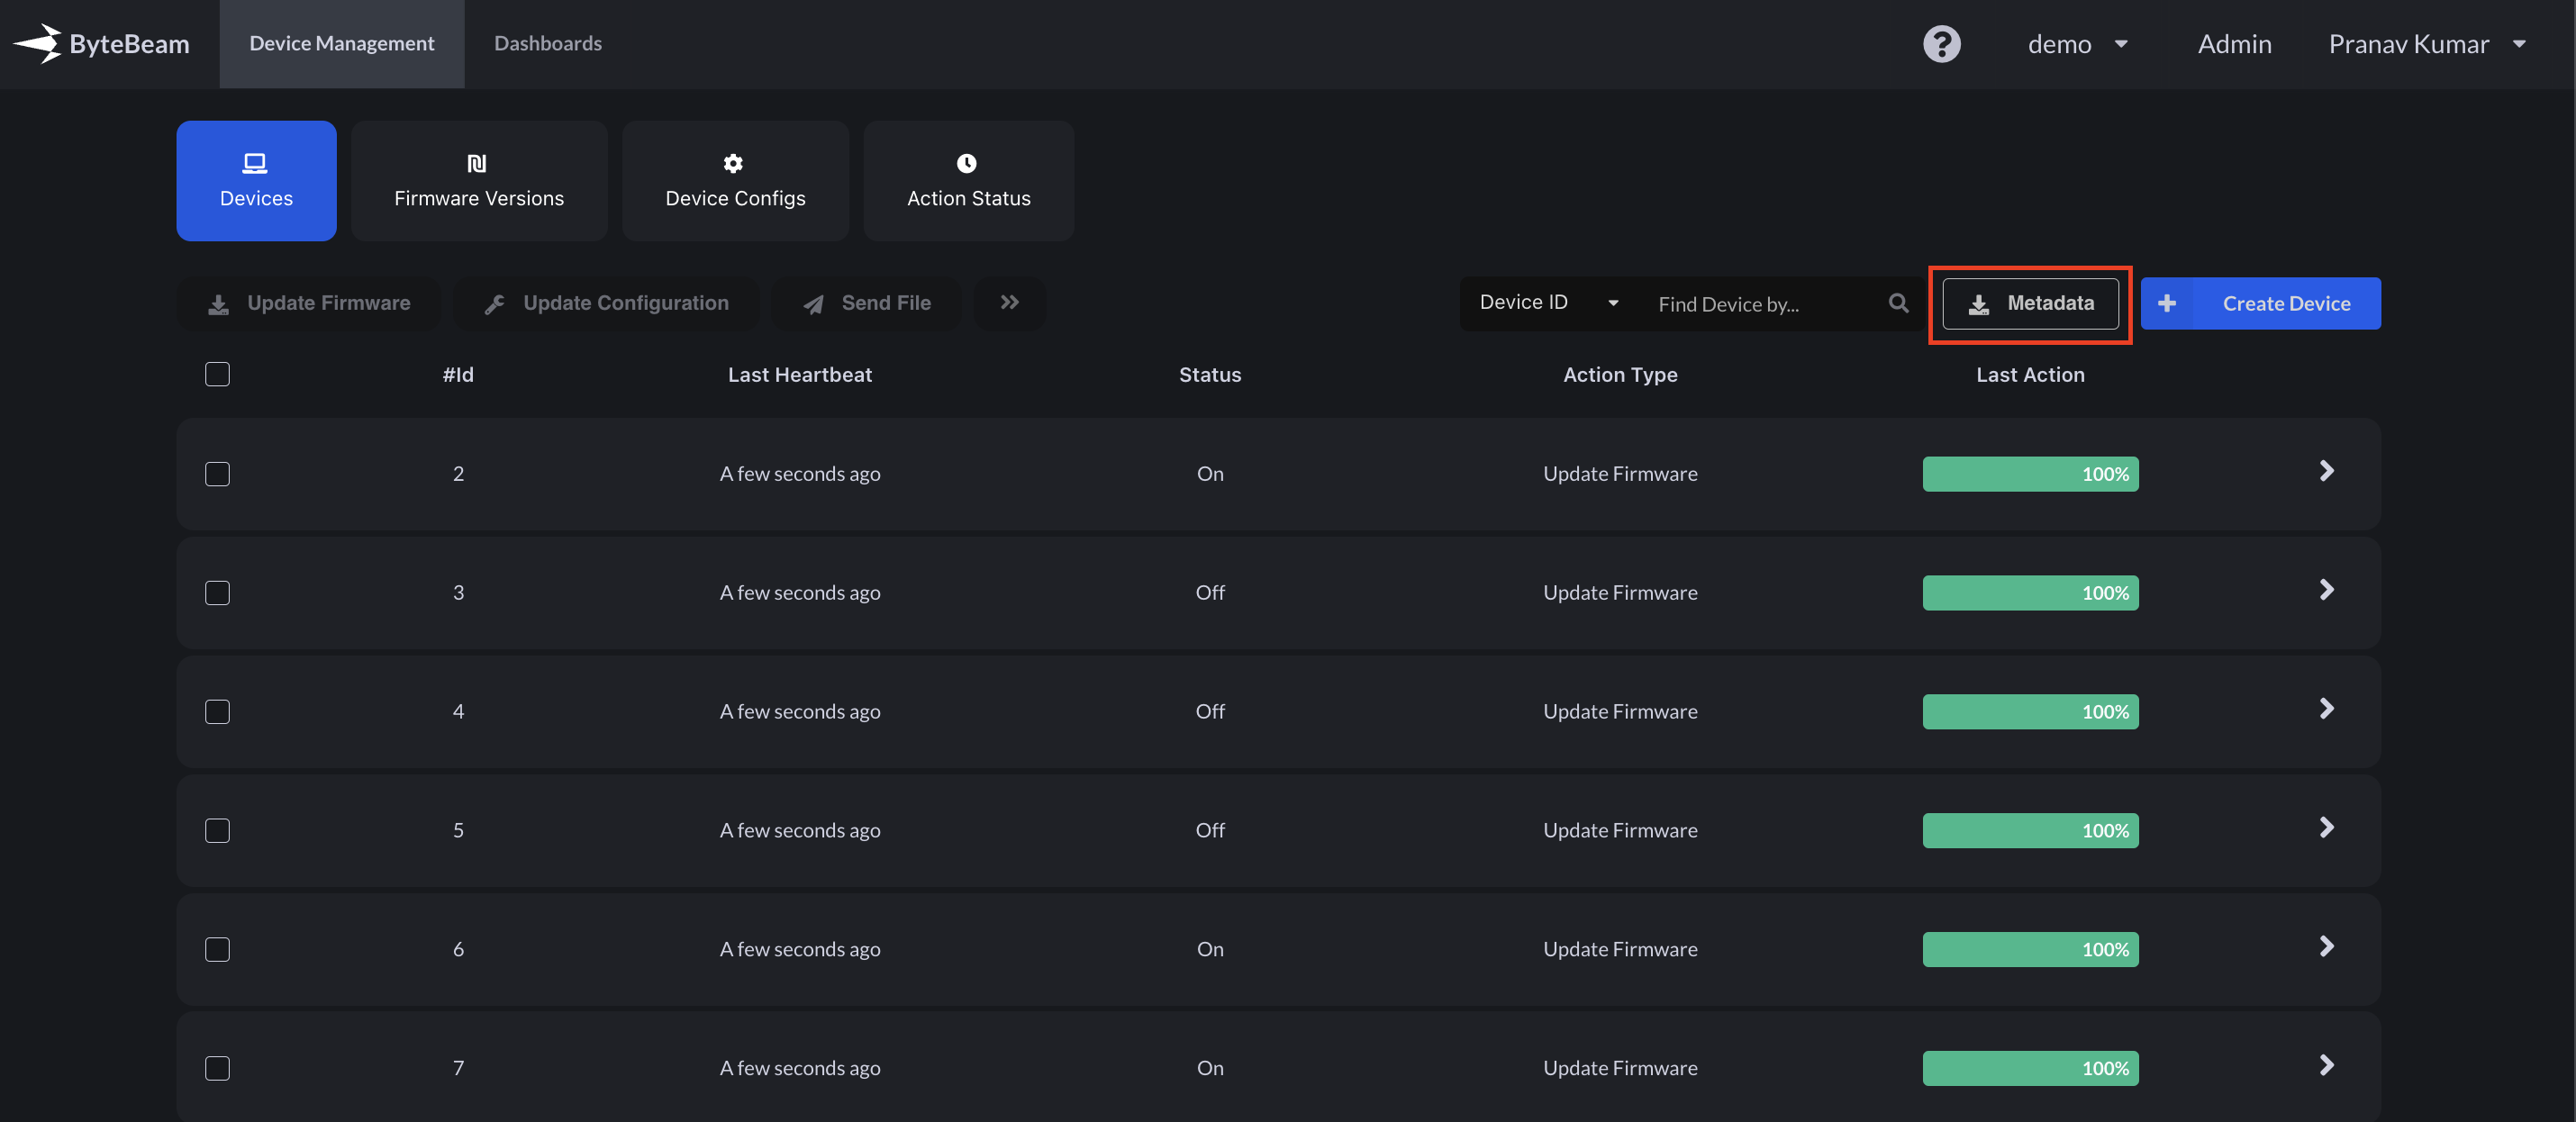
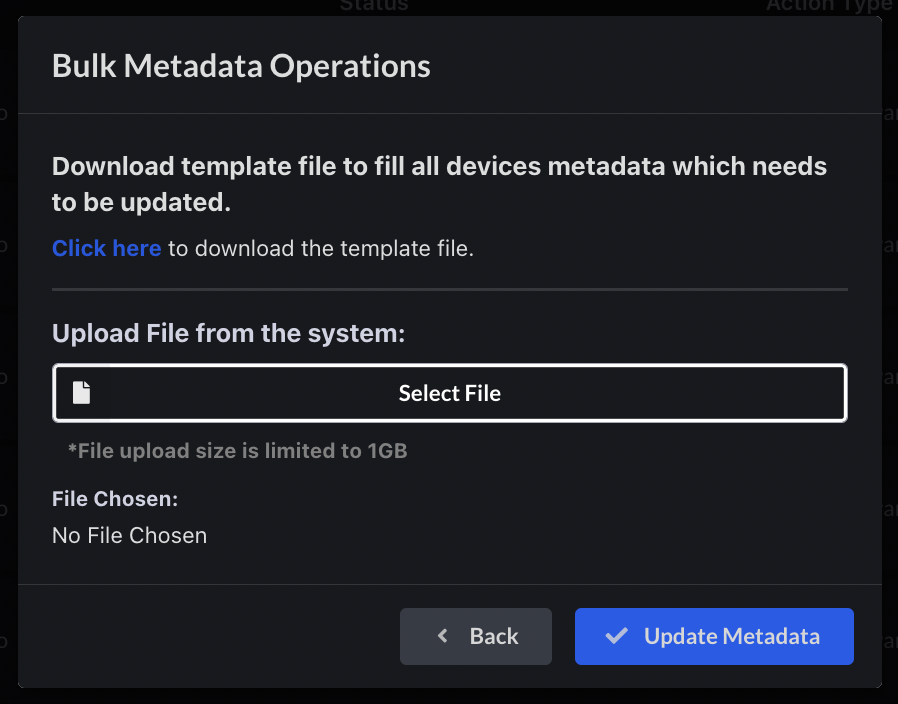
 ### Self-serve UI for bulk update of metadata
From the user interface, it is now possible for a user to update metadata in bulk. The user can download the template file, modify it, and use it to update metadata in bulk.
### Self-serve UI for bulk update of metadata
From the user interface, it is now possible for a user to update metadata in bulk. The user can download the template file, modify it, and use it to update metadata in bulk.
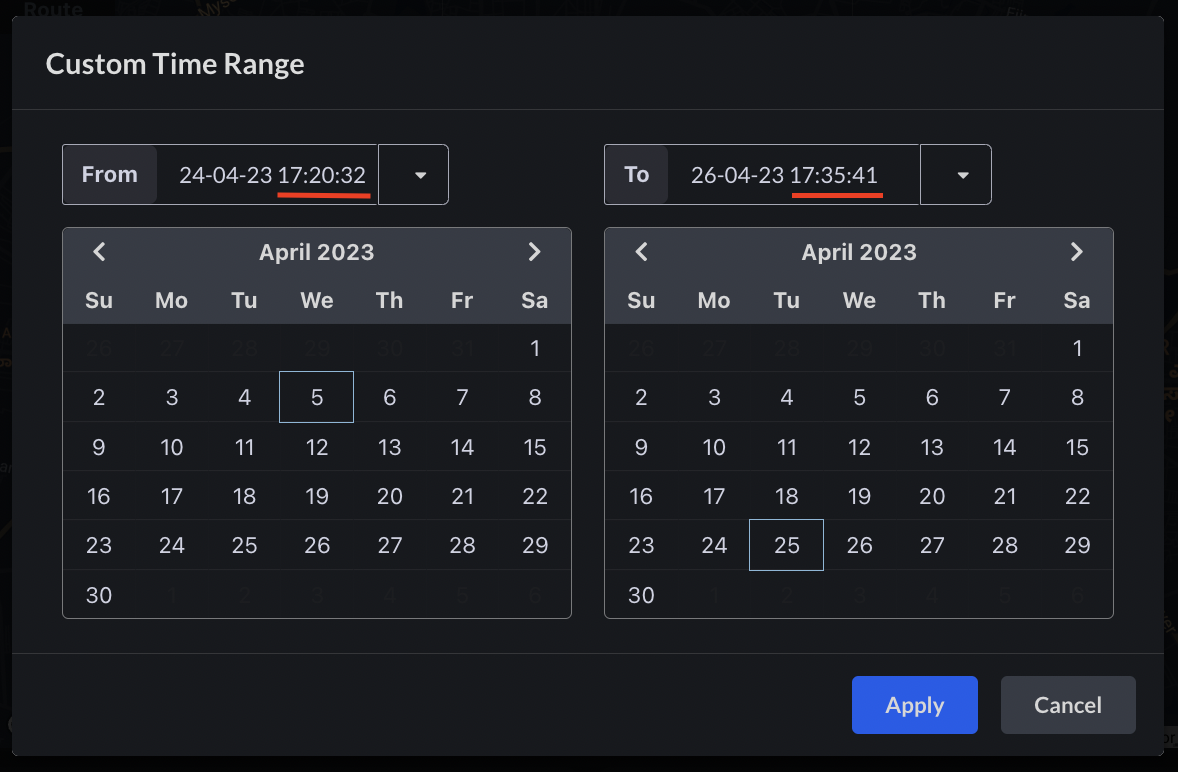
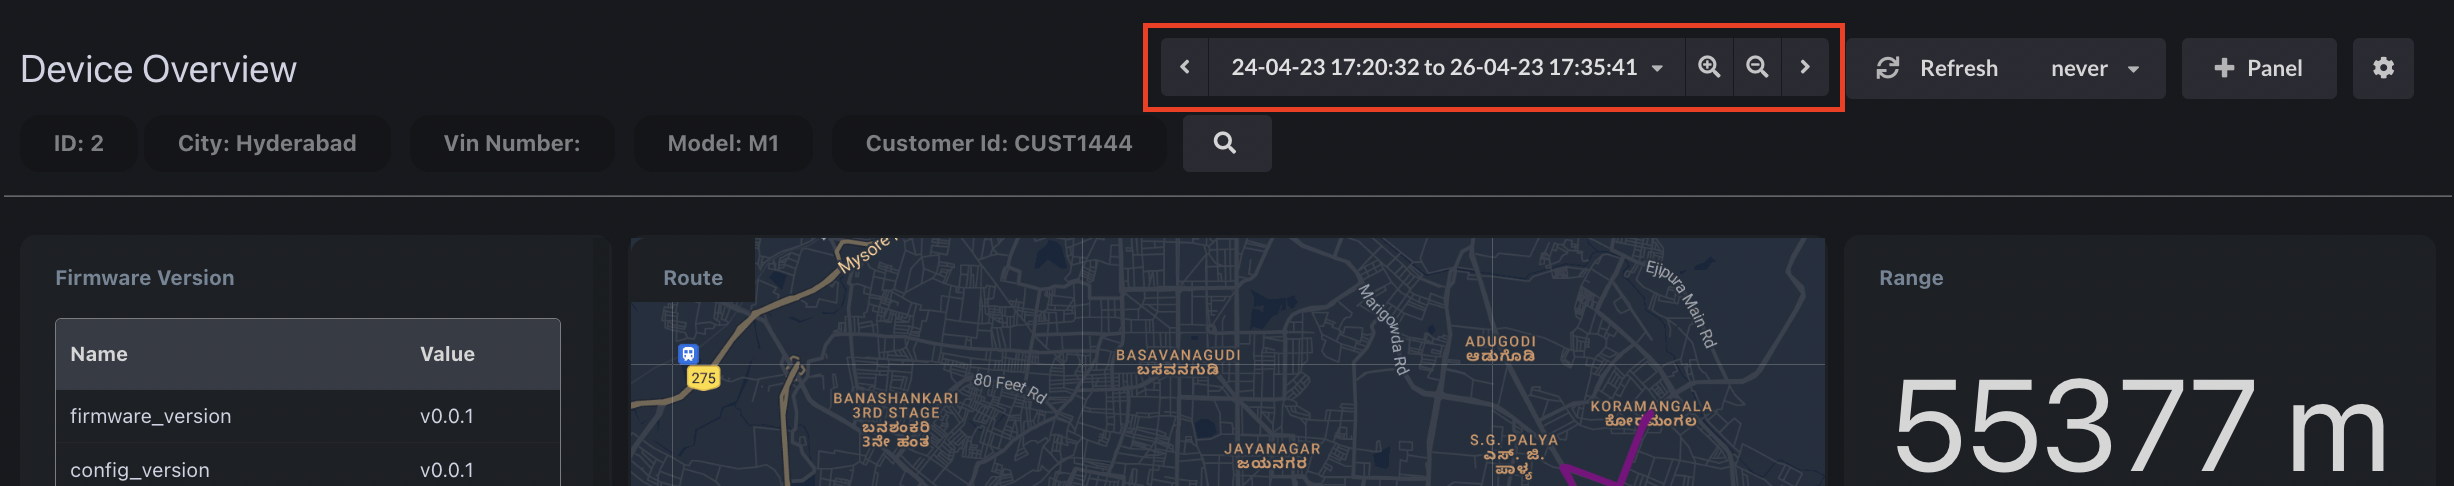
 ### The timerange on the dashboard now has support for precision up to seconds
The user can now manually update the seconds precision while selecting a timerange on the dashboard by selecting a time from the UI and then making the necessary adjustments.
### The timerange on the dashboard now has support for precision up to seconds
The user can now manually update the seconds precision while selecting a timerange on the dashboard by selecting a time from the UI and then making the necessary adjustments.
 ### Bug fixes & Minor changes
* The issues related to auto-refresh in the incremental loading of the dashboard have been resolved.
* The bug causing the dashboard to continuously load has been resolved.
* The issue with pagination in the timeseries panel for raw CAN data (high frequency data) has been resolved.
* The bug causing preset filters to be automatically added to a dashboard in certain cases has been fixed.
### Bug fixes & Minor changes
* The issues related to auto-refresh in the incremental loading of the dashboard have been resolved.
* The bug causing the dashboard to continuously load has been resolved.
* The issue with pagination in the timeseries panel for raw CAN data (high frequency data) has been resolved.
* The bug causing preset filters to be automatically added to a dashboard in certain cases has been fixed.